Introduction
Prior to starting our project, we need to set out the project schedule. This is the intended timeline for our project and will include the estimated time it will take us to complete each task and milestones for when key events are expected to occur. Read this project schedule guide to discover more.
The final product of our project schedule is the Gantt chart. This is a clear visual representation of our project schedule. In order to get to our Gantt chart, we first need to understand the work that is involved in our project through a work breakdown structure (WBS) and then arrange that in the intended sequence of completion (a precedence diagram). It is useful to understand each step of this process so that we can easily produce a useful project schedule.
The work breakdown structure (WBS)
The first step in creating our project schedule is to produce the WBS. The WBS will be created as part of the process of defining the project scope. It allows the project manager to have an overview of all of the work required to complete the project.
You do not have access to view this content.
The WBS is the foundation of our schedule. When we know the work that needs to be done in order to complete our project, we can then move on to assigning timeframes for completing that work, building up our schedule.
Precedence diagrams
The WBS presents the project work as a hierarchy – the work packages feed into the tasks which feed into the project as a whole. The precedence diagram is more useful for the project manager when planning the project schedule. Precedence diagrams take the task information from the WBS and put it into the logical order for completing the project. Setting the tasks out in the order of completion allows us to understand dependencies which help us to estimate the time that it will take to complete each task.
The precedence diagram method is useful to know so that you understand how to create a schedule from scratch. Each work element from the WBS is given a node in the precedence diagram. A node gives us lots of useful information about the duration of the work, start and finish dates and whether there is any contingency in the form of total float.
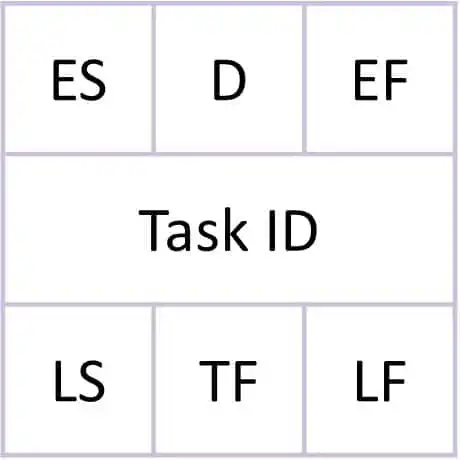
Figure 1 A precedence diagram node.
ES = early start (the earliest the task can start)
D = duration (the length of time we have estimated the task will take)
EF = early finish (the earliest the task can finish)
LS = late start (the latest the task can start)
TF = total float (a type of contingency)
LF = late finish (the latest the task can finish)
The first thing that we do is assign a duration to each task. This will be an estimate of how long we think the work is going to take.
We then need to complete the forward pass. To do this, a 0 goes into the ES box in the first node, as our project will start at week/day 0. We then simply add the duration to the ES to get EF. We continue this process throughout the precedence diagram, carrying the EF of the previous task into the ES of the following task. If we reach a point where two separate workstreams need to come together, we take the higher of the two EF numbers as our ES.
Once we have completed our forward pass, we need to complete our backwards pass. This follows the same principle as the forward pass, but this time we are taking the duration away from the LF to get the LS and starting at the end of the precedence diagram. To get the LF for the final node, we simply take the EF from the same node. We then move backwards through the precedence diagram taking the duration away from the LF to get the LS and carrying the LS of the task back to become the LF of the preceding task. If we reach a point where two separate workstreams need to come together, we take the lower of the two LS numbers as our LF.
The final step is to work out the total float. This is a form of time contingency within our schedule. To calculate the TF, we use the formula LF – EF = TF. Then we simply do this calculation for each node.
Once we fill the precedence diagram with all of this information, we have a completed precedence diagram. We can take the information in this precedence diagram and use this to create the Gantt chart which is the final product of our project schedule.
Gantt charts
Gantt charts are a useful visual tool for displaying the project schedule. They are one of the most common and useful tools that the project manager has at their disposal.
The Gantt chart clearly sets out the duration of each task on the project, along with indicating any total float.
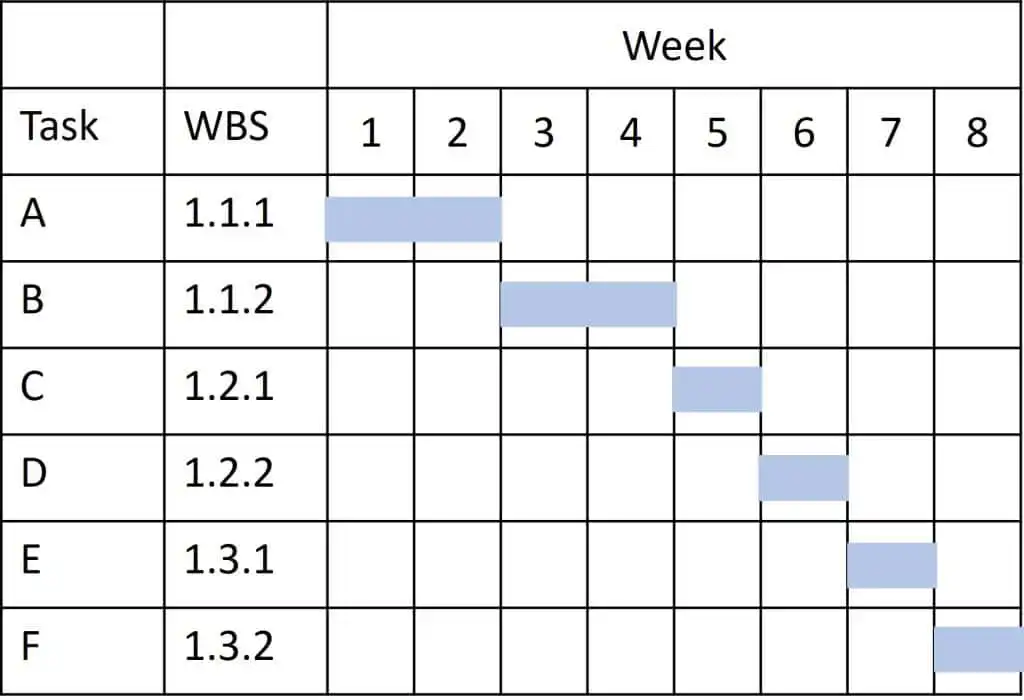
Figure 2 A simple example Gantt chart.
Once we have the Gantt chart, we have a finalised project schedule. If we need to make changes to the project schedule, we will need to alter the duration information that we have and recalculate the information in the precedence diagram to update our Gantt chart. This is something that tools like Microsoft Project or Asana will do automatically. You simply put in the start and finish date of each task, and it will output the Gantt chart. This makes the process of scheduling easier, but it is useful to understand how the whole schedule is calculated.
Summary
Creating the project schedule is an important part of our project. It sets out the timelines for our project, around which we are going to plan our work and other key milestones. We start with a WBS, which can be used to create a precedence diagram from which we derive the Gantt chart. Each of these steps gives us a deeper understanding of the timeline of our project. Once we have a project schedule we can continue with other planning tasks, such as resourcing and procuring materials for our project.
